HTML Viewer
Paste HTML code to see the rendered page live and test phone, tablet and desktop widths.
About the HTML Viewer
What is an HTML viewer?
An HTML viewer is a browser-based tool that renders HTML code into the page a browser would display.
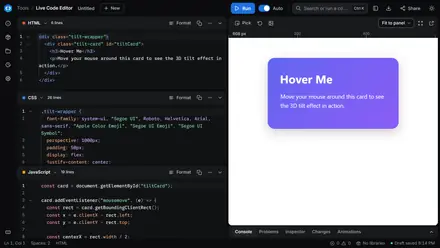
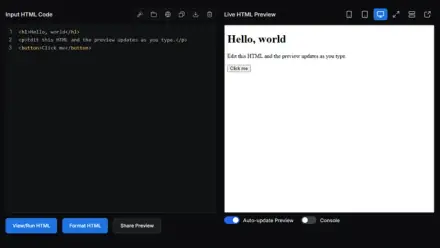
You paste or open the code and the rendered result appears next to the source, without saving a file or setting up a server. The rendering happens in your own browser inside a sandboxed frame. It uses the same engine that draws every other web page, so the preview matches what your own browser, whether Chrome, Edge, Safari or Firefox, would show.
CSS inside a style tag takes effect, JavaScript inside a script tag runs, and the phone and tablet buttons resize the frame to test media queries.
Facts worth knowing before you paste
- The preview renders locally. The code you paste or open stays in your browser and is never uploaded or stored. The one exception is fetching a page by URL, which asks our server to download that page's source for you.
- The frame is sandboxed. Scripts and forms run inside it, but they cannot reach your cookies or your sessions on other sites.
- Files up to 10 MB open by drag and drop. 52 file types are accepted, from .html and .htm to .svg, .xml, .css, .js, .json and .md, plus template formats such as .php, .vue, .jsx and .twig.
- Mobile view is 375 by 600 pixels and tablet view is 768 by 600. Desktop uses the full pane, and Fullscreen or a new tab gives the preview the whole window.
- The console panel replaces DevTools for small tests. It catches console.log, warnings, errors, uncaught exceptions with their line numbers and unhandled promise rejections.
- Share Preview puts the code inside the link. The code is compressed with the browser's built-in deflate algorithm and stored after the # in the URL, which never reaches a server, and the person opening it sees a notice before anything runs.
How to view HTML online
- Paste or open the HTML. Type in the editor, paste a snippet or a whole page, drag a file onto it, or use the toolbar to open a file, fetch a page's source by URL or load the sample.
- Watch the preview. With Auto-update Preview on, the pane repaints as you type, and for documents over 40,000 characters it waits a quarter of a second between repaints so typing stays smooth. Turn it off and press View/Run HTML to refresh by hand.
- Check phone and tablet widths. The device buttons resize the frame to 375 or 768 pixels wide, the layout button stacks the editor above the preview or puts them side by side, and the new-tab button opens the preview on its own.
- Read the console. Output and errors from your script appear under the preview with line numbers, and the Console switch hides the panel for a clean render.
- Keep or share the result. Copy or download the code from the toolbar, press Format HTML to tidy the indentation, or press Share Preview for a link that opens the same snippet for anyone.
Example
This document will be converted to the page a browser shows. Auto-update Preview is on:
Input: HTML
<!DOCTYPE html>
<html>
  <body>
    <h1>What an HTML viewer shows</h1>
    <p>Paste HTML code and see the rendered page.</p>
    <ul>
      <li>Headings, paragraphs and lists</li>
      <li>Images, tables and links</li>
      <li>CSS styles and media queries</li>
    </ul>
  </body>
</html>
Output: rendered page
What an HTML viewer shows
Paste HTML code and see the rendered page.
- Headings, paragraphs and lists
- Images, tables and links
- CSS styles and media queries
Switch to Mobile view and the same page redraws at 375 pixels wide, which is how you catch a layout that only breaks on a phone.
Ways to open an HTML file
An HTML file opens in several programs, and each one shows something different.
| Method | What you see | Best for |
|---|---|---|
| Double-click the file | The rendered page in your default browser | Reading a saved page |
| Right-click, Open with a text editor | The code, not the page | Editing without a preview |
| Chrome: drag the file into a tab, Ctrl+U, F12 | The page, its source, or DevTools | Inspecting a page you already have open |
| Microsoft Word | The file as a document, with Word's own markup added when you save | Copying text out, not testing code |
| The CodeShack HTML viewer | Code and rendered page side by side, with console output and phone widths | Testing, debugging and sharing a snippet |
Common mistakes
- Expecting every external file to load. A stylesheet or script loads from a public https URL. A path on your own computer, an http URL on this https page, or a host that blocks hotlinking never appears, so paste the CSS inline or link a CDN copy such as the Tailwind or Bootstrap CDN links.
- Testing without the doctype. The preview renders in standards mode whatever you paste. A real page without
<!DOCTYPE html>at the top falls into quirks mode, so a layout that looks right here can shift once it goes live. - Using relative paths. A src of images/logo.png points nowhere inside the preview because there is no folder behind it. Use a full URL or a data URI.
- Pasting server-side code. PHP, Twig or ASP tags never run in a browser. The browser reads a PHP tag as a comment and hides it, while Twig and ASP tags show up as plain text. Paste the HTML the server would output instead.
Common Use Cases
A scratch pad that renders as you type gets used for more than page layouts:
- Debugging a layout. Paste the broken section on its own to see whether the markup or a conflicting stylesheet is at fault.
- Prototyping a component. Tweak a button, a card or a menu in isolation and watch the change.
- Testing an embed code. Video iframes, widgets and tracking snippets show up here before they touch a real page.
- Checking an email template. Table layouts and inline styles render here as a browser draws them, a first check before the real email clients.
- Learning HTML. Type a tag and see the result, with nothing to install.
The viewer pairs with the rest of the HTML toolbox. Tidy messy markup with the HTML Formatter, find unclosed tags and duplicate ids with the HTML Validator, shrink the final version with the HTML Minifier, or diff two versions of a page in HTML Compare.
Frequently Asked Questions
How do I view an HTML file?
Double-click the file and your default browser renders it. To see the code and the rendered page side by side, open the file in this HTML viewer by dragging it onto the editor or using the Open button, up to 10 MB.
How can I view HTML online?
Paste the code into an online HTML viewer and the preview renders as you type. It runs in your own browser with no account and no upload, and our viewer also opens dropped files and fetches a page's source by URL.
How can I open HTML in Chrome?
Drag the .html file into a Chrome tab or press Ctrl+O to open it. Ctrl+U shows a page's source and F12 opens DevTools, but Chrome has no side-by-side editor and preview, which is what an HTML viewer adds.
Why can't I open an HTML file in my browser?
The file is usually linked to another program or was saved with a .txt extension. Right-click it and choose Open with a browser, or rename the extension to .html, and if the page opens but looks broken it is missing the CSS, images or scripts it references.
Is it safe to open an HTML file?
An HTML file can contain scripts, so treat one from a stranger like any other attachment. This viewer runs the file in a sandboxed frame that cannot reach your cookies or your logins on other sites, which is safer than opening it directly.
Can Microsoft Word open HTML?
Yes, Word opens .htm and .html files as documents. It adds its own markup and ignores scripts when it saves a page, so use a browser or an HTML viewer to see the page as intended.
What is the best HTML viewer?
The best HTML viewer renders code locally, runs JavaScript in a sandbox, shows console output and tests phone widths. Check those four points before pasting anything private.